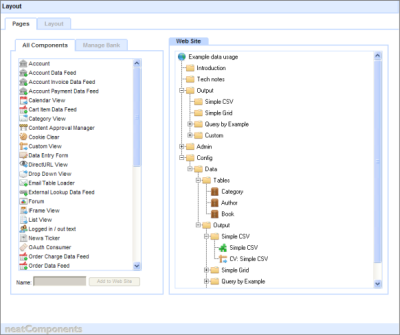
The data example takes the standard 'blank site' provided by the system as its basis. It uses the color scheme, sizing, and navigation-style from that site. These settings are full customizable but are not covered in this tutorial (read how ...). Assumptions
This example shows how to capture data from a web interface, work with it in several common ways, and display all or some of it on a web-page. The example assumes that data is entered from a web form as that is by far the most common scenario, but it could be data import or an external look-up. It further assumes that the display of the results and searching is 'public', while data entry is restricted to users with permission. For convenience, this example uses the same data in four different types of display or output, CSV, Grid, Query-by-Example and Custom. Each display has a matching configuration section. Once you have understood how these basic interactions work you are encouraged to explore all the dialogs associated with the components. Creating logical structure
 Display section
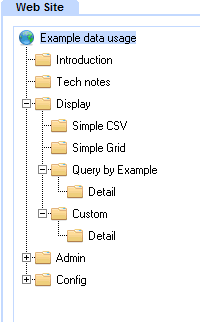
The Display section has been populated with Pages. Each page is visible to the Public. The pages are used as a 'surface' on which is embedded the output from querying the data. When you examine one of these pages by opening the Text Editor you will see that it shows, in this case, an embedded Custom View. You can right-click on the embed to examine its properties, and then drill down to the underlying components that were used to configure it. The more advanced Display examples have secondary pages - called 'Detail'. This allows you to have a search function on the primary page, with the display on a secondary. The primary page is being used both as a 'surface' and a 'container'. The secondary page is hidden in the navigation, but not permissioned out. The display on this page is controlled by the parameters used in the query to restrict down the view to the correct result set. 
Config section
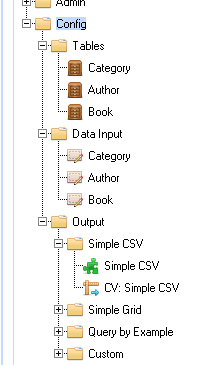
The Config section has its permissions set so that you must be logged-in to access it. It is divided into three main section: Tables, Data Input, Output This example is based on a book catalog, so there are three Tables one each for Category, Author and Book. There is background information on designing data-structures here at data normalization. Each table has a matching Data Entry Form. The Data Entry Form enable you to construct a custom form for entering data into the table. These Data Entry Forms have a fully customizable 'surface' which can be a simple or elaborate as you wish. The Output section is divided into four sections, each matching the display 'Output'. The Query acts as the central connector marshalling the data stored before it is displayed. It is one of the core components in the system.
The Custom View is one of the most used and powerful components, whilst being conceptually quite simple. It provides a text surface on which you can embed fields from an underlying Query. Because the text surface can be formatted and styled you have complete control over the appearance of the content.

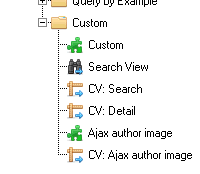
The example 'custom' section of the Config has additional components to allow for the creation of a more complex display - more like a real world example. The Search View gives a more comprehensive search facility than the previous example. The display Output page includes a simple example of an Ajax transition to deliver an image on mouse over of a trigger. Here you see the components necessary for these additional functions. |